
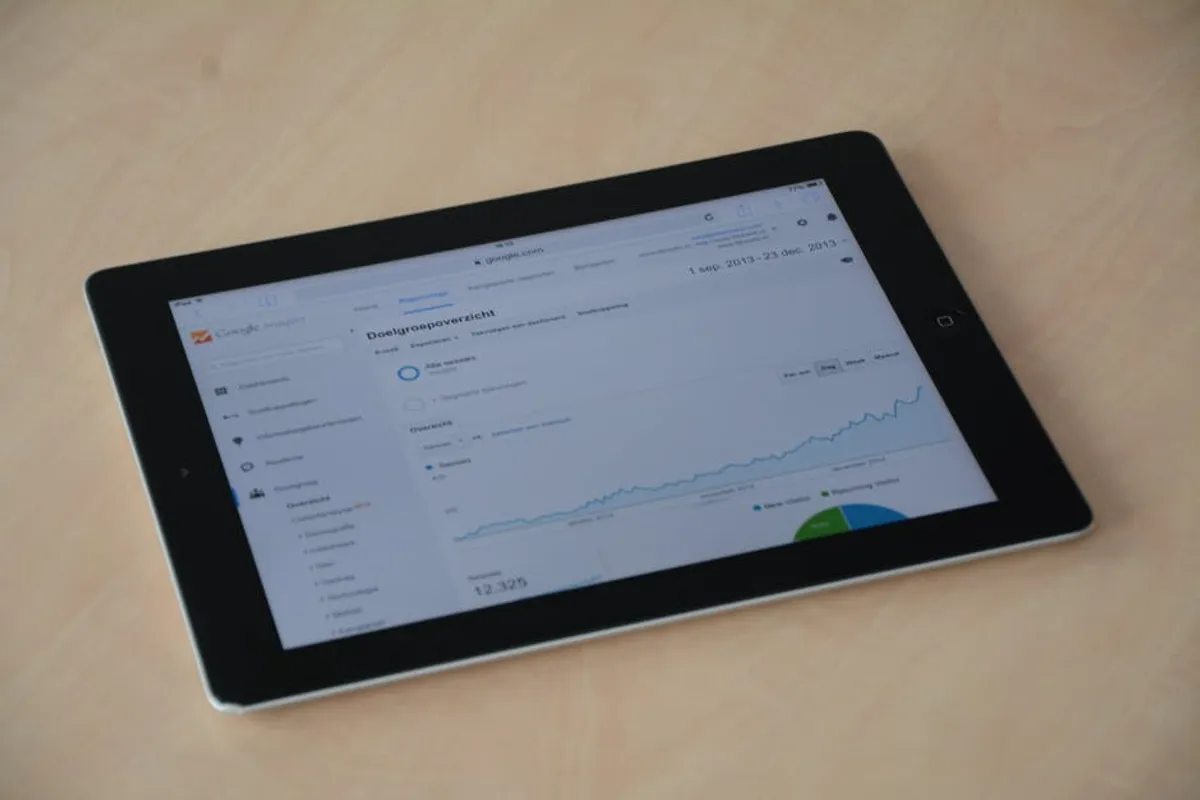
Effective conversion rate optimization (CRO) is not a guessing game; it is a data-driven discipline. Relying on intuition or best practices alone often leads to suboptimal results or wasted resources. The foundational principle of successful CRO is the systematic analysis of user behavior and site performance data to identify specific areas for improvement. This approach shifts CRO from a series of speculative changes to a continuous, informed process, ensuring that every optimization effort is grounded in evidence and aimed at measurable gains. Understanding how to extract, interpret, and act upon this data is critical for any marketer or site owner looking to maximize their digital assets' commercial value. This informed approach means you should also consider tracking micro-conversions to gain a more granular understanding of user journeys.
Establishing Your CRO Goals and Key Performance Indicators
Before diving into analytics, define what "conversion" means for your specific business objectives. Conversions can range from micro-interactions to macro-transactions, and clear definitions are essential for accurate measurement and targeted optimization.
Defining Conversion Events
Conversion events are the specific actions you want users to take on your site. These must be precisely defined within your analytics platform to ensure accurate tracking. For an e-commerce site, a macro conversion is typically a completed purchase. Micro conversions might include adding an item to a cart, signing up for a newsletter, downloading a whitepaper, or viewing a key product page. Each of these events provides valuable insight into the user journey and potential friction points.
Identifying Key Performance Indicators (KPIs)
KPIs are the metrics that directly reflect your progress toward your CRO goals. These are not merely observations but measurable values that indicate performance. For an e-commerce platform, relevant KPIs might include:
- Conversion Rate (overall and per product/category)
- Average Order Value (AOV)
- Revenue Per Visitor (RPV)
- Cart Abandonment Rate
- Checkout Completion Rate
- Lead-to-Customer Conversion Rate (for lead generation sites)
- Bounce Rate on key landing pages
- Time on Page for critical content
Selecting the right KPIs ensures that your analytical focus remains on metrics that directly impact commercial outcomes, rather than vanity metrics that offer little actionable insight.
Leveraging Analytics Tools for Data Collection
The efficacy of your CRO efforts hinges on the quality and granularity of your data. Generic, out-of-the-box analytics setups often fall short of providing the depth required for meaningful optimization.
Setting Up Tracking Correctly
Accurate data collection begins with meticulous implementation of analytics tracking. This involves ensuring all relevant pages are tagged, custom events are configured for specific user interactions (e.g., button clicks, form submissions, video plays), and e-commerce tracking is fully operational. Verify that data layers are correctly implemented for enhanced e-commerce metrics and that cross-domain tracking is configured if users traverse multiple domains during their journey. Regular audits of your analytics setup are crucial to catch tracking errors that can skew data and lead to incorrect CRO decisions.
Segmenting Your Audience Data
Raw, aggregate data often masks critical insights. Segmenting your audience allows you to analyze how different user groups behave. Useful segments include:
- Traffic Source: Organic search, paid ads, social media, referral, direct.
- Device Type: Desktop, mobile, tablet.
- Geographic Location: Country, region, city.
- New vs. Returning Users: Their behavior often differs significantly.
- Demographics: Age, gender (if available and relevant).
- Behavioral Segments: Users who viewed specific pages, added items to cart but didn't purchase, or interacted with particular features.
Analyzing these segments reveals disparities in conversion rates and user experience, pinpointing specific areas where optimization efforts will yield the highest returns.
Analyzing User Behavior Patterns
Understanding the "why" behind user actions requires a deeper dive into their journey through your site. This involves moving beyond simple page views to reconstruct their path and identify obstacles.
Funnel Analysis for Drop-Off Points
A conversion funnel maps the typical path users take towards a desired conversion. By visualizing this path within your analytics, you can identify where users drop off. For an e-commerce checkout, this might involve steps like "product page view," "add to cart," "begin checkout," "shipping information," "payment information," and "purchase confirmation." High drop-off rates at specific stages signal potential usability issues, unclear calls to action, or unexpected friction points that need immediate attention.
Heatmaps and Session Recordings
While standard analytics tell you *what* happened, tools that provide heatmaps and session recordings offer insights into *how* users interact with your pages. Heatmaps visually represent where users click, move their mouse, or scroll, highlighting areas of interest or neglect. Session recordings allow you to watch anonymized user journeys, revealing specific points of confusion, hesitation, or frustration that quantitative data alone cannot capture. These qualitative insights are invaluable for forming hypotheses for A/B tests.
A/B Testing Data Interpretation
Analytics plays a crucial role in interpreting the results of A/B tests. Beyond simply identifying the "winner," you need to understand *why* one variation performed better. Analyze conversion rates, bounce rates, time on page, and engagement metrics for both variations across different segments. A variation might perform better overall but poorly for mobile users, or vice versa. This granular analysis informs subsequent tests and builds a deeper understanding of your audience's preferences.
Pro Tip: Always ensure your A/B tests achieve statistical significance before declaring a winner. Running a test for too short a period or with insufficient traffic can lead to false positives, where observed differences are due to random chance rather than a true impact of the change. Relying on statistically insignificant results can lead to implementing changes that do not actually improve conversion rates, wasting development resources and potentially harming performance.
Prioritizing Optimization Opportunities
With a wealth of data points and potential issues identified, the next step is to prioritize which optimizations to tackle first. Not all issues have equal impact or require the same effort.
Quantifying Impact and Effort
A common framework for prioritization involves assessing the potential impact of an optimization against the effort required to implement it. High-impact, low-effort changes (often called "quick wins") should be addressed first. High-impact, high-effort changes might be strategic projects. Low-impact changes, regardless of effort, should be deferred or reconsidered. Analytics data helps quantify the potential impact by showing how many users are affected by an issue and the potential uplift in conversions if resolved.
Iterative Testing and Learning
CRO is an iterative process. Each optimization, whether successful or not, generates new data and insights. Document all tests, their hypotheses, results, and learnings. This creates a knowledge base that informs future optimization strategies, preventing the repetition of failed experiments and building upon successful ones. The goal is to continuously refine your understanding of your users and your site's performance.
Translating Insights into Actionable Tests
The ultimate goal of using analytics for CRO is to move from data observation to concrete action. Every insight should lead to a testable hypothesis, designed to validate a potential solution to an identified problem.
For example, if funnel analysis shows a high drop-off on the shipping information page, a hypothesis might be: "Adding a progress bar and clear shipping cost estimates earlier in the checkout process will reduce drop-offs on the shipping page." This hypothesis then forms the basis for an A/B test. The test's outcome, measured through analytics, will either confirm the hypothesis (leading to implementation) or refute it (leading to a new hypothesis and test).
Building a Data-Driven Optimization Loop
Sustained CRO success comes from embedding analytics into a continuous optimization loop. This involves a cycle of data collection, analysis, hypothesis generation, testing, and implementation, followed by further monitoring and refinement. This iterative process ensures that your website or application is constantly evolving based on real user behavior, driving incremental improvements that accumulate into significant commercial gains over time. By prioritizing data-backed decisions, you move beyond subjective opinions and towards a truly performance-driven approach to digital growth.
Frequently Asked Questions
What is the primary benefit of using analytics for CRO?
The primary benefit is moving beyond guesswork to make data-backed decisions, ensuring that optimization efforts are focused on real user problems and have a measurable impact on conversion rates and revenue.
How often should I review my analytics for CRO?
The frequency depends on your traffic volume and the pace of changes on your site. For active sites, weekly or bi-weekly deep dives are advisable, supplemented by daily monitoring of key metrics for anomalies.
What are common pitfalls to avoid when using analytics for CRO?
Common pitfalls include relying on vanity metrics, making decisions based on insufficient data or statistical insignificance, failing to segment data, and not regularly auditing your tracking setup for accuracy.
Can analytics alone guarantee CRO success?
No, analytics provides the "what" and often the "where" of performance issues. Successful CRO also requires qualitative research (e.g., user surveys, usability tests) to understand the "why," and creative problem-solving to design effective solutions and tests.